
다른 명령
ASH 아카텍처
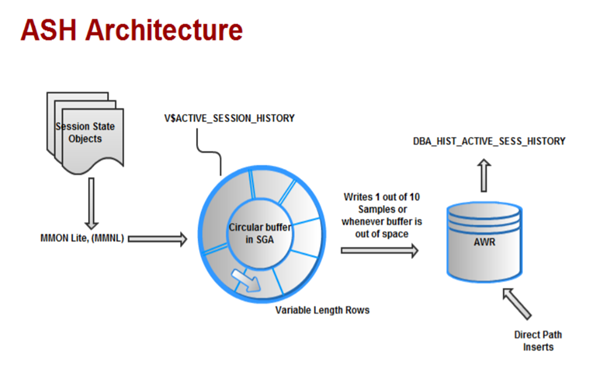
- ASH는 실시간 세션(Actvie Session)의 활동 정보, SQL 수행 빈도 등의 정보를 1초 간격으로 수집
- SGA -> Shared Pool -> ASH Buffer 영역에 보관해뒀다가 가득 차게 되면 AWR로 내려씁니다.
- ASH 정보를 디스크로 내려 쓰는 역할을 담당하는 Background Process는 MMNL
Active Session History
- V$ACTIVE_SESSION_HISTORY 뷰는 인스턴스에서 샘플링된 세션 활동을 제공
- 활성 세션은 매초마다 샘플링되어 SGA의 순환 버퍼에 저장
- 데이터베이스에 연결되어 있고 유휴 대기 클래스에 속하지 않는 이벤트를 기다리는 모든 세션은 활성 세션으로 간주
- 샘플링 시점 CPU에 있었던 모든 세션 정보 포함
- V$ACTIVE_SESSION_HISTORY 뷰는 샘플당 각 활성 세션에 대해 하나의 행을 반환하며 최신 세션 샘플 행을 먼저 반환
- 활성 세션 샘플은 SGA의 순환 버퍼에 저장되기 때문에 시스템 활동이 클수록 순환 버퍼에 저장할 수 있는 세션 활동의 시간(초)은 줄어듬.
- 즉, 세션 샘플이 V$뷰에 나타나는 기간 또는 V$뷰에 표시되는 세션 활동의 시간(초)은 전적으로 데이터베이스 활동에 따라 달라짐.
- AWR(Automatic Workload Repository) 스냅샷의 일부로 V$ACTIVE_SESSION_HISTORY의 콘텐츠도 디스크로 플러시 됨
- 이 V$뷰의 내용은 과도한 시스템 활동 중에 상당히 커질 수 있으므로 세션 샘플의 일부만 디스크에 기록 함
- active 세션만 캡처하면 시스템에서 허용되는 세션 수가 아니라 수행 중인 작업과 직접 관련된 크기로 관리 가능한 데이터 세트가 표시
- active 세션 기록을 사용하면 V$ACTIVE_SESSION_HISTORY 뷰의 현재 데이터와 DBA_HIST_ACTIVE_SESS_HISTORY 뷰의 기록 데이터 모두에 대한 자세한 분석을 검사하고 수행할 수 있으므로 추가 성능 추적 정보를 수집하기 위해 워크로드를 재생할 필요가 없는 경우가 많음
- 활성 세션 기록에는 캡처된 각 SQL 문에 대한 실행 계획 정보도 포함
- 이 정보는 SQL 실행의 어느 부분이 SQL 경과 시간에 가장 크게 기여했는지 식별하는 데 사용
- ASH에 있는 데이터는 다음을 포함하여 캡처하는 다양한 차원에서 롤업 가능
- SQL 문의 SQL 식별자 (SQL identifier of SQL statement)
- SQL 문을 실행하는 데 사용되는 SQL 계획의 SQL 계획 식별자 및 해시 값(SQL plan identifier and hash value of the SQL plan used to execute the SQL statement)
- SQL 실행 계획 정보 (SQL execution plan information)
- 개체 번호, 파일 번호 및 블록 번호 (Object number, file number, and block number)
- 대기 이벤트 식별자 및 매개변수 (Wait event identifier and parameters)
- 세션 식별자 및 세션 일련 번호 (Session identifier and session serial number)
- 모듈 및 작업 이름 (Module and action name)
- 세션의 클라이언트 식별자 (Client identifier of the session)
- 서비스 해시 식별자 (Service hash identifier)
- 소비자 그룹 식별자 (Consumer group identifier)
시간별 시스템 리소스 통계 수치 조회
- v$active_session_history
- v$sysmetric_history
SELECT sysmetric_history.sample_time
     , cpu/60 AS cpu
     , bcpu/60 AS bcpu
     , DECODE(SIGN((cpu+bcpu)/60-cpu_ora_consumed), -1, 0, ((cpu+bcpu)/60-cpu_ora_consumed)) AS cpu_ora_wait
     , scheduler/60 AS scheduler
     , uio/60 AS uio
     , sio/60 AS sio
     , concurrency/60 AS concurrency
     , application/60 AS application
     , COMMIT/60 AS COMMIT
     , configuration/60 AS configuration
     , administrative/60 AS administrative
     , network/60 AS network
     , queueing/60 AS queueing
     , clust/60 AS clust
     , other/60 AS other
  FROM (SELECT TRUNC(sample_time,'MI') AS sample_time
             ,
     DECODE(session_state,'ON CPU',DECODE(session_type,'BACKGROUND','BCPU','ON CPU'), wait_class) AS wait_class
   FROM v$active_session_history
   WHERE sample_time>sysdate-INTERVAL '1' HOUR
   AND sample_time<=TRUNC(SYSDATE,'MI')) ash
   PIVOT (COUNT(*) FOR wait_class IN ('ON CPU' AS cpu,'BCPU' AS bcpu,'Scheduler' AS scheduler,'User I/O' AS uio,'System I/O' AS sio,
   'Concurrency' AS concurrency,'Application' AS application,'Commit' AS COMMIT,'Configuration' AS configuration,
   'Administrative' AS administrative,'Network' AS network,'Queueing' AS queueing,'Cluster' AS clust,'Other' AS other)) ash
, (SELECT
      TRUNC(begin_time,'MI') AS sample_time,
      VALUE/100 AS cpu_ora_consumed
    FROM v$sysmetric_history
    WHERE GROUP_ID=2
    AND metric_name='CPU Usage Per Sec') sysmetric_history
 WHERE ash.sample_time (+)=sysmetric_history.sample_time
ORDER BY sample_time;
ACTIVE SESSION HISTORY TOP 10
- v$active_session_history
select * from (
	select
		 SQL_ID ,
		 sum(decode(session_state,'ON CPU',1,0)) as CPU,
		 sum(decode(session_state,'WAITING',1,0)) - sum(decode(session_state,'WAITING', decode(wait_class, 'User I/O',1,0),0)) as WAIT,
		 sum(decode(session_state,'WAITING', decode(wait_class, 'User I/O',1,0),0)) as IO,
		 sum(decode(session_state,'ON CPU',1,1)) as TOTAL
	from v$active_session_history
	where SQL_ID is not NULL
	group by sql_id
	order by sum(decode(session_state,'ON CPU',1,1))   desc
	)
where rownum <11
TOP 이벤트
select event
     , sum(wait_time +time_waited) ttl_wait_time
  from v$active_session_history
 where sample_time between sysdate - 60/2880 and sysdate
 group by event
 order by 2
TOP 세션
- v$active_session_history
- v$session
select sesion.sid,sesion.username
     , sum(ash.wait_time + ash.time_waited)/1000000/60 ttl_wait_time_in_minutes
  from v$active_session_history ash
     , v$session sesion
 where sample_time between sysdate - 60/2880 and sysdate
   and ash.session_id = sesion.sid
 group by sesion.sid, sesion.username
 order by 3 desc
Top SQL 조회
- v$active_session_history
- v$sqlarea
- dba_users
SELECT active_session_history.user_id , dba_users.username
     , sqlarea.sql_text , SUM(active_session_history.wait_time +active_session_history.time_waited)/1000000 ttl_wait_time_in_seconds
  FROM v$active_session_history  active_session_history
     , v$sqlarea sqlarea
     , dba_users
 WHERE active_session_history.sample_time BETWEEN SYSDATE - 1 AND SYSDATE
   AND active_session_history.sql_id = sqlarea.sql_id
   AND active_session_history.user_id = dba_users.user_id
   AND dba_users.username <>'SYS'
 GROUP BY active_session_history.user_id,sqlarea.sql_text, dba_users.username
 ORDER BY 4 DESC
Top 세그먼트
- v$active_session_history
- dba_objects
SELECT dba_objects.object_name,dba_objects.object_type
     , active_session_history.event
     , SUM(active_session_history.wait_time + active_session_history.time_waited) ttl_wait_time
  FROM v$active_session_history active_session_history
     , dba_objects
 WHERE active_session_history.sample_time BETWEEN SYSDATE - 1 AND SYSDATE
   AND active_session_history.current_obj# = dba_objects.object_id
 GROUP BY dba_objects.object_name, dba_objects.object_type, active_session_history.event
 ORDER BY 4 DESC
IO가 많이 사용하는 쿼리
- gv$active_session_history
- gv$event_name
SELECT sql_id
     , COUNT(*)
  FROM gv$active_session_history ash
     , gv$event_name evt
 WHERE ash.sample_time > SYSDATE - 1/24
   AND ash.session_state = 'WAITING'
   AND ash.event_id = evt.event_id
   AND evt.wait_class = 'User I/O'
 GROUP BY sql_id
 ORDER BY COUNT(*) DESC;

SELECT *
 FROM TABLE(dbms_xplan.display_cursor('&SQL_ID));
Top 10 CPU 소비 (60분 동안)
- v$active_session_history
select * from
(
select session_id, session_serial#, count(*)
from v$active_session_history
where session_state= 'ON CPU' and
 sample_time > sysdate - interval '60' minute
group by session_id, session_serial#
order by count(*) desc
)
where rownum <= 10;
Top 10 대기세션 (60분동안)
- v$active_session_history
select * from
(
select session_id, session_serial#,count(*)
  from v$active_session_history
 where session_state='WAITING'
   and sample_time >  sysdate - interval '60' minute
 group by session_id, session_serial#
 order by count(*) desc
)
where rownum <= 10;
SQL sid로 세션 정보조회
select serial# , username , osuser
     , machine , program , resource_consumer_group
     , client_info
from v$session where sid=&sid;
(60분간) 세션id별 다르게 실행된 SQL 조회
select distinct sql_id, session_serial#
  from v$active_session_history
 where sample_time >  sysdate - interval '60' minute
   and session_id=&sid
SQL 전체 내용 조회, sqltext(CLOB)
select sql_fulltext
  from v$sql
 where sql_id='&sql_id'
sql의 SID로 세션 대기 이력(session wait history) 검색
- v$session_wait_history
select *
  from v$session_wait_history
 where sid=&sid
find all wait events for above top session
- v$session_event
select event
     , total_waits
     , time_waited/100/60 time_waited_minutes
     , average_wait*10 aw_ms
     , max_wait/100 max_wait_seconds
  from v$session_event
 where sid=&sid
 order by 5 desc
유저,SID의 세션 항목별(CPU,..,) 통계
- v$session
- v$sesstat
- v$statname
select s.sid,s.username
     , st.name
     , se.value
  from v$session s
     , v$sesstat se
     , v$statname st
 where s.sid=se.SID
   and se.STATISTIC#=st.STATISTIC#
--and st.name ='CPU used by this session'
--and s.username='&USERNAME'
   and s.sid='&SID'
 order by s.sid,se.value desc
ash size 변경
- alert log 내용중
Active Session History (ASH) performed an emergency flush. This may mean that ASH is undersized.
If emergency flushes are a recurring issue, you may consider increasing ASH size by
setting the value of _ASH_SIZE to a sufficiently large value. Currently,
ASH size is 17000944 bytes. Both ASH size and the total number of emergency flushes
since instance startup can be monitored by running the following query:
select total_size,awr_flush_emergency_count
  from v$ash_info;
발생원인
- Active session 증가에 따른 ASH 버퍼 부족
- 시스템의 일부 활동으로 인해 더 많은 Active session이 발생하여 ASH 버퍼를 평소보다 빠르게 채우면 alert log에 위 메시지가 표시됨
- 메세지 그 자체는 문제가 아니며 데이터베이스에서 최대 활동을 지원하기 위해 버퍼를 늘려야 할 수도 있음
버전별 최대 사이즈
- 11g 이하에서 "_ash_size"의 설정 가능한 최대 크기는 254MB(즉, 2MB 크기의 127개 청크)
- 12c 이상에서 "_ash_size"의 설정 가능한 최대 크기는 254MB 이상
- "_ash_size" 를 더 높은 값을 설정할 수 있지만 내부적으로 254MB로 조정됨
- 254MB 이상의 값으로 설정하면 ORA-2097 메세지가 발생
-- 400MB로 설정 시
SQL> alter system set "_ash_size"=419430400;alter system set "_ash_size"=419430400

*
ERROR at line 1:
ORA-02097: parameter cannot be modified because specified value is invalid
ORA-02097: parameter cannot be modified because specified value is invalid
- ORA-2097 메세지가 발생함